Creating Components
Marcelle can be extended using custom components, that can be created locally in an application.
In this tutorial, we will create a custom component for the visualization of datasets using Uniform Manifold Approximation and Projection (UMAP). UMAP is a dimension reduction technique that can be used for visualisation similarly to t-SNE, but also for general non-linear dimension reduction.
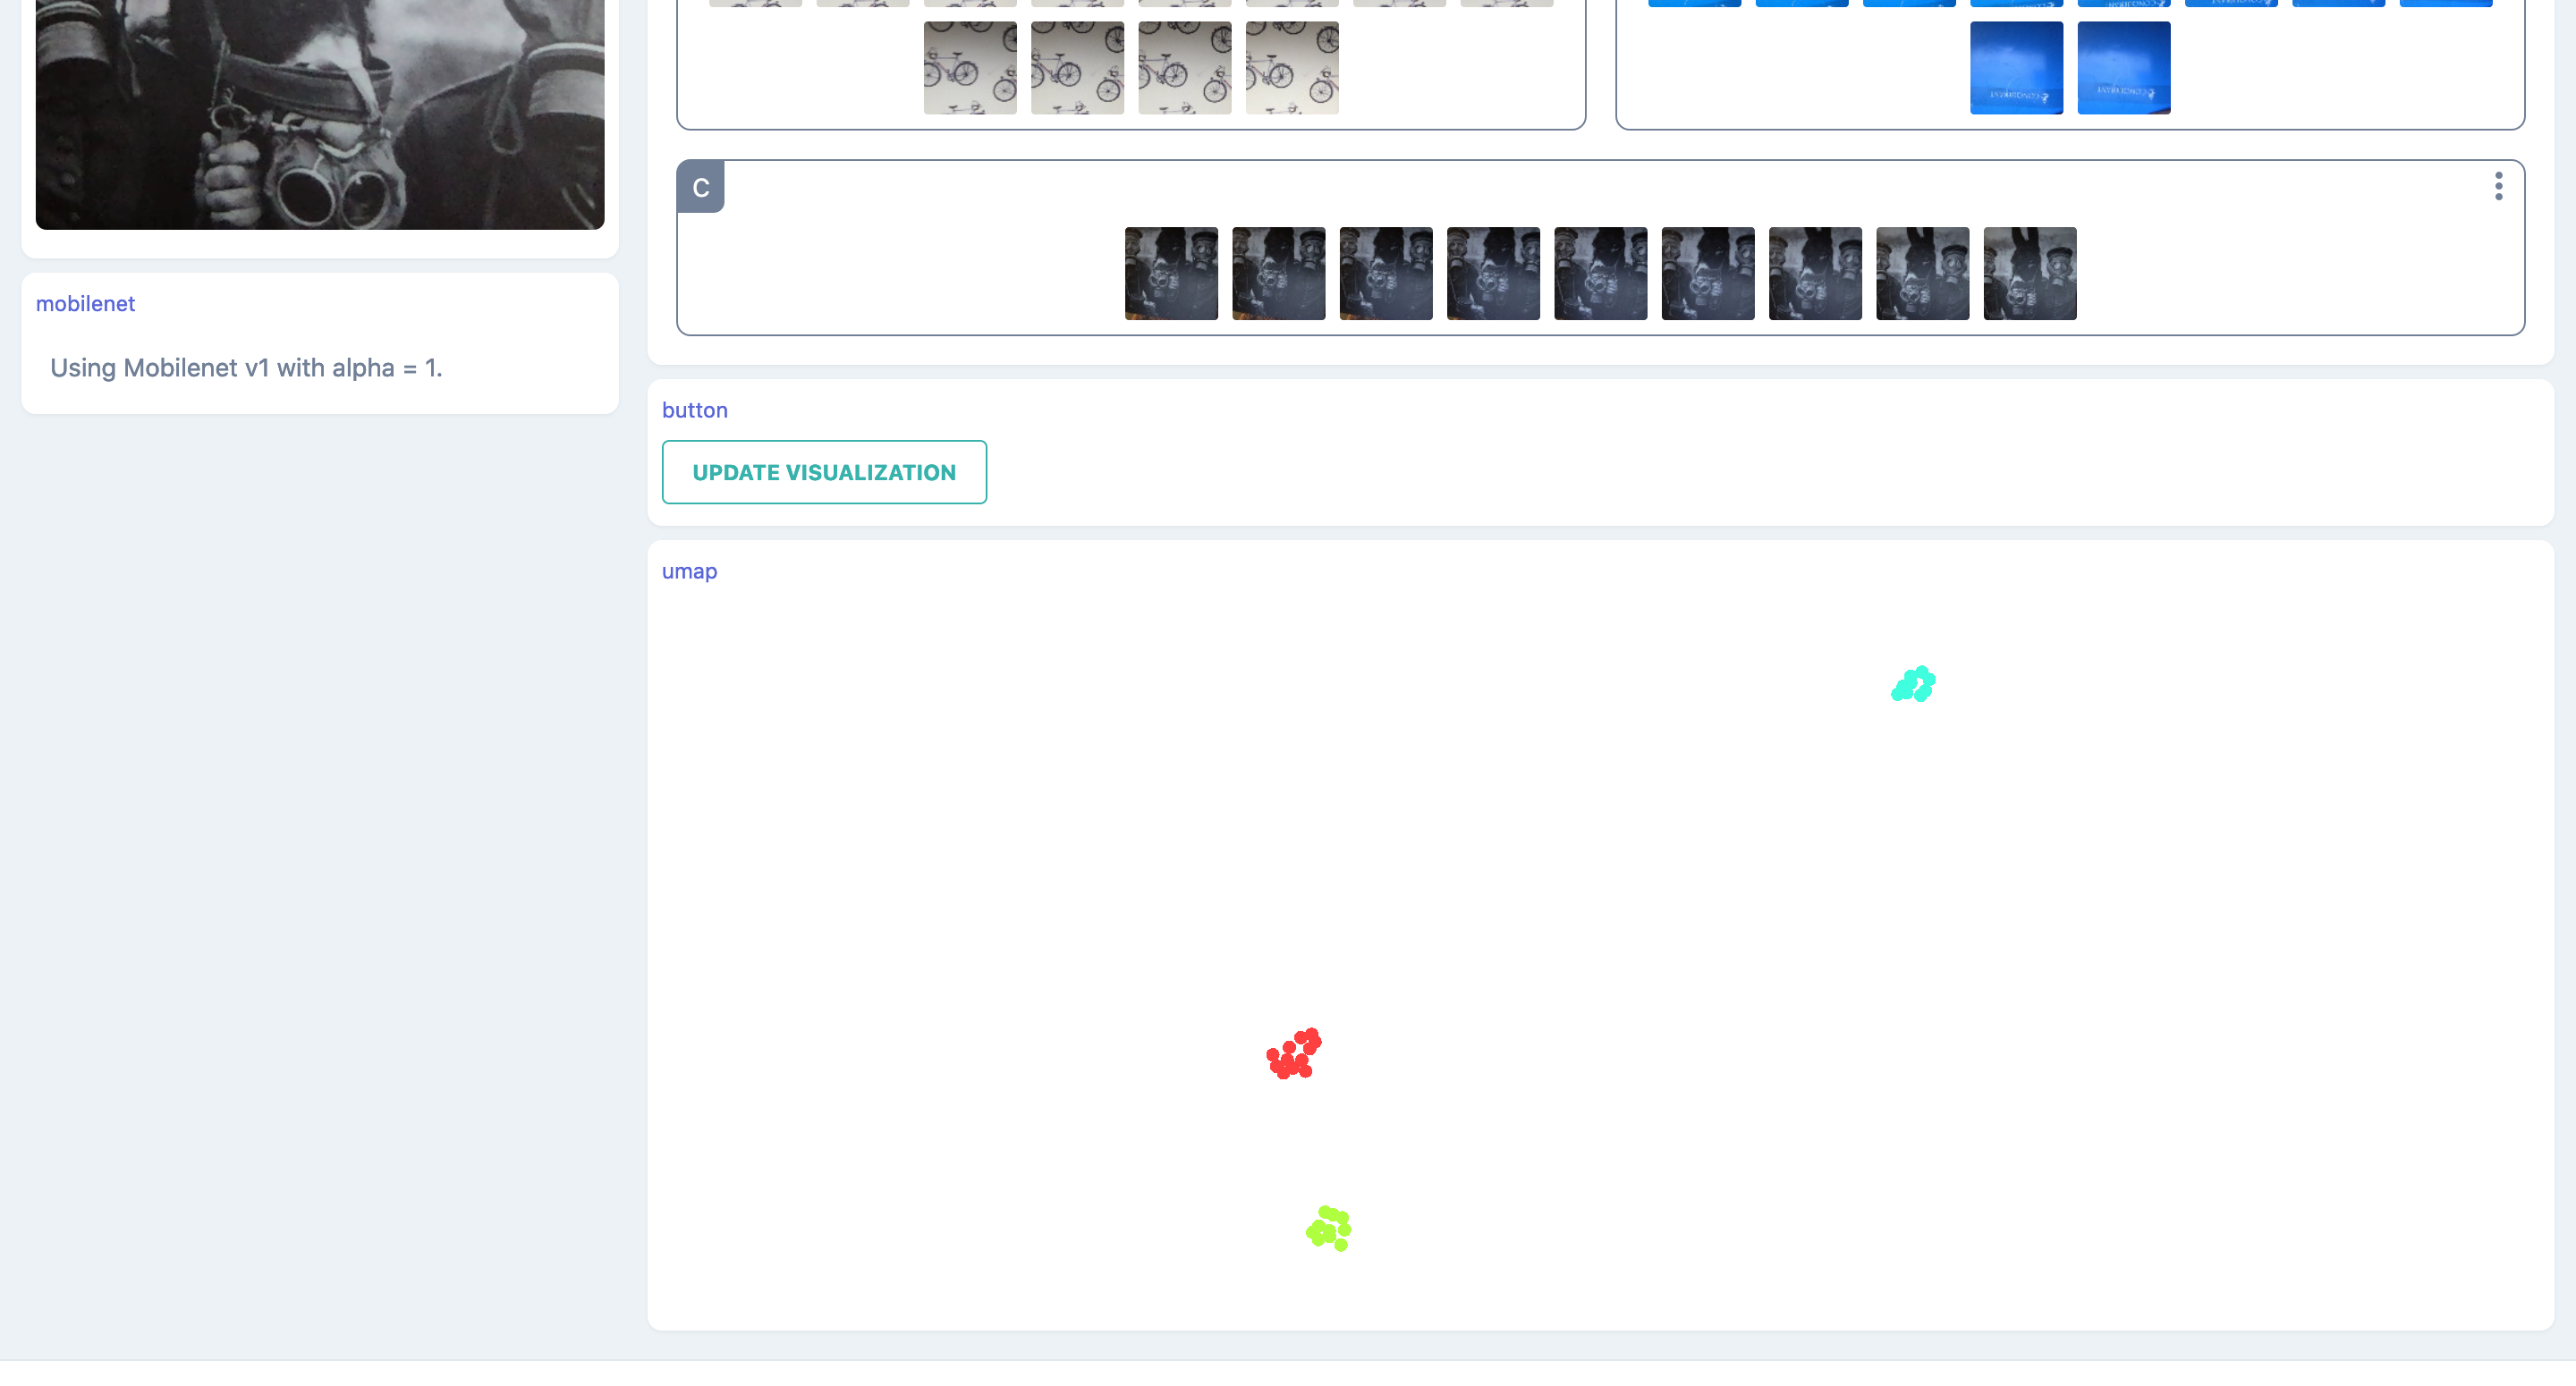
Here is what the final application looks like (try it on demos.marcelle.dev):
The details for the underlying mathematics can be found in the following paper on ArXiv:
McInnes, L, Healy, J, UMAP: Uniform Manifold Approximation and Projection for Dimension Reduction, ArXiv e-prints 1802.03426, 2018
Generating the application
Let's start by generating a new Marcelle application:
Select the default options of the CLI. Then, make sure the application works by running the development server:
npm run dev
And open http://localhost:3000 in your browser.
Then, update the main application entry point (src/index.js) with the application skeleton:
src/index.js
import '@marcellejs/core/dist/marcelle.css';
import {
  datasetBrowser,
  mobileNet,
  dataset,
  dataStore,
  dashboard,
  textInput,
  imageUpload,
} from '@marcellejs/core';

// -----------------------------------------------------------
// INPUT PIPELINE & DATA CAPTURE
// -----------------------------------------------------------

const input = imageUpload();
const featureExtractor = mobileNet();

const label = textInput('cat');
label.title = 'Label (to record in the dataset)';

const $instances = input.$images
  .zip(
    async (thumbnail, img) => ({
      type: 'image',
      x: await featureExtractor.process(img),
      y: label.$value.get(),
      thumbnail,
    }),
    input.$thumbnails,
  )
  .awaitPromises();

const store = dataStore('localStorage');
const trainingSet = dataset('TrainingSet-Umap', store);

$instances.subscribe(trainingSet.create);

const trainingSetBrowser = datasetBrowser(trainingSet);

// -----------------------------------------------------------
// DASHBOARDS
// -----------------------------------------------------------

const dash = dashboard({
  title: 'Marcelle Example - Dashboard',
  author: 'Marcelle Pirates Crew',
});

dash.page('Data Management').sidebar(input, label, featureExtractor).use(trainingSetBrowser);
dash.settings.datasets(trainingSet);

dash.show();
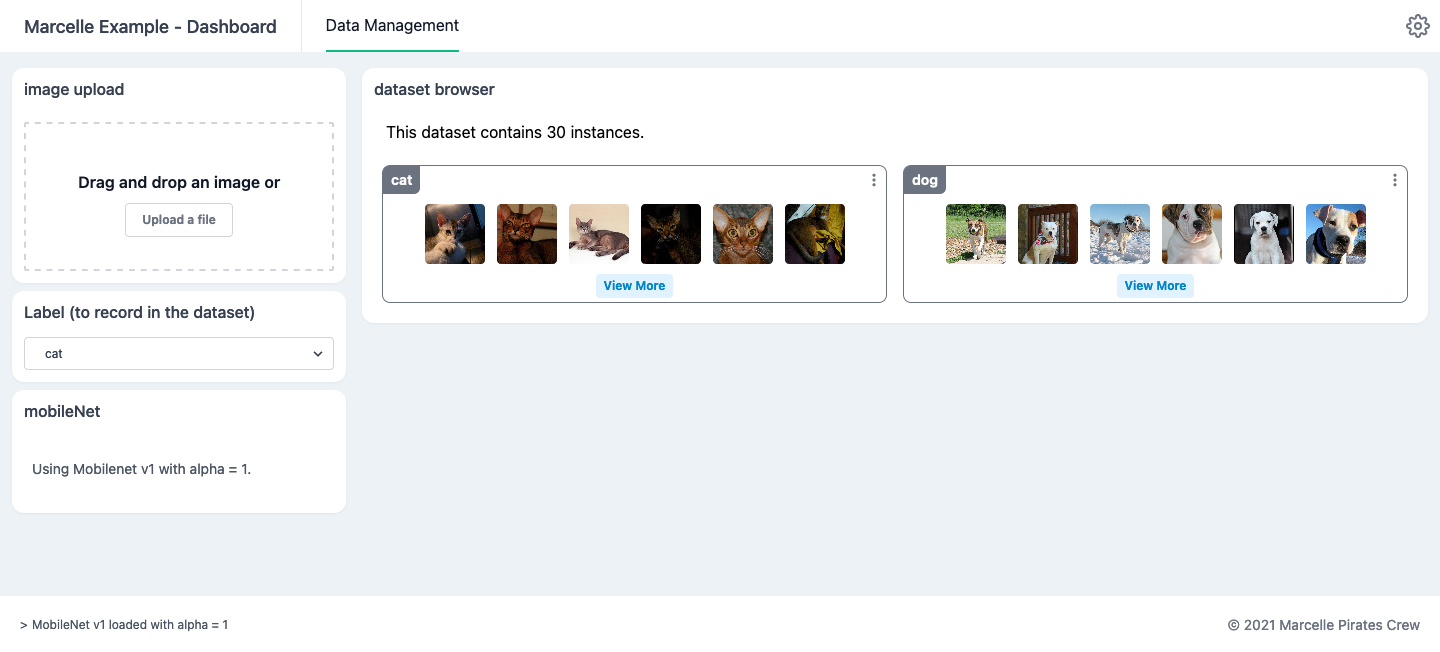
The application's input is an image upload component, and images are preprocessed using the pretrained neural network Mobilenet. Training data can be captured to a dataset called TrainingSet. You can download the data here. Unzip the folder, then in the Marcelle application:
- Select 'cat' in the menu and drop all cat images
- Select 'dog' in the menu and drop all dog images
You should obtain the following application:
Generating a Component
Components are essentially JavaScript objects exposing a set of streams for communicating with other Marcelle components, and optionally providing a view. The easiest way to generate a new component is using the CLI:
Select 'Create a component', choose the name 'umap', the CLI will generate the following files:
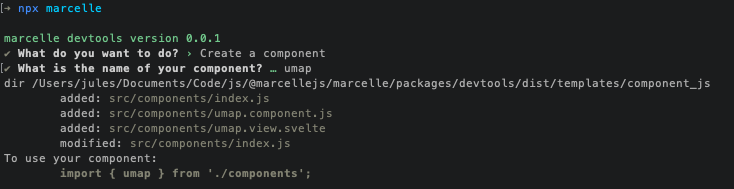
src/components/umap/umap.component.jscontains the main component class definitionsrc/components/umap/umap.view.svelteis a Svelte component defining our component's viewsrc/components/umap/index.jsis used to export a constructor function for the component
The generated component is already functional. Let's start by displaying it in our application. Edit src/index.js to import the component, create a new instance, and display it in the dashboard:
import '@marcellejs/core/dist/marcelle.css';
import {
  ...
} from '@marcellejs/core';
import { umap } from './components';

// ...

const trainingSetBrowser = datasetBrowser(trainingSet);

const trainingSetUmap = umap();

// ...

dash
  .page('Data Management')
  .sidebar(input, label, featureExtractor)
  .use(trainingSetBrowser, trainingSetUmap);
dash.settings.use(trainingSet);

dash.show();
You should see the custom component appear in the dashboard:

Anatomy of a component
Let's inspect what constitutes a component. A component is composed of three files
src/components/umap/umap.component.jscontains the main component class definitionsrc/components/umap/umap.view.svelteis a Svelte component defining our component's viewsrc/components/umap/index.jsis used to export a constructor function for the component
The main component definition is a class in umap.component.js:
// Our custom UMAP component extends the base class "Component"
export class Umap extends Component {
  constructor(options = {}) {
    super();
    this.title = 'umap [custom component 🤖]';
    this.options = options;
  }

  // Component methods
}
The constructor specifies the component's title, which is displayed when a component is added to the dashboard. Additionally, we can pass parameters to the component's constructor. In this case, the component accepts an arbitrary object of options.
Let's try passing options to the component. In the main script, update the instanciation of the component:
const trainingSetUmap = umap({ someParam: 'Yes', other: 33 });
The list of parameters should be displayed in the component view on the dashboard. Component views are created using the component's .mount() method. This method can either be called manually by the user, or automatically if the component is added to a dashboard's page. The mount method optionally takes a HTML element where the component should be displayed. If no target element is specified, the component will be mounted on the element with id corresponding to the component's unique id (automatically generated).
Marcelle does not enforce the use of a particular framework to build the view of a modular. While the core library uses the Svelte framework, it is possible to use any frontend framework such as Vue or React, or even to program the view using vanilla JavaScript.
When using svelte, the mount method has the following form:
  mount(target) {
    const t = target || document.querySelector(`#${this.id}`);
    if (!t) return;
    this.destroy();
    this.$$.app = new Component({
      target: t,
      props: {
        title: this.title,
        options: this.options,
      },
    });
  }
Where the actual view is defined in the svelte component umap.view.svelte. A Svelte component is composed of:
- a
<script>part defining the component's data and logic in JavaScript - a
<style>part defining CSS classes - the view definition in HTML
In our example, we define "props" in the script part by using the keyword export. Props are parameters that can be passed to our component when it is instanciated in the mount method. Our component accepts two props: title and options, that are then displayed in the HTML. Note that use use curly braces {options} to display in the HTML the contents of a JavaScript variable or expression.
<script>
  import { ViewContainer } from '@marcellejs/design-system';
  export let title;
  export let options;
</script>

<ViewContainer {title}>
  <div>This is a <span class="my-color">custom</span> component with the following options:</div>
  <p>{JSON.stringify(options)}</p>
</ViewContainer>

<style>
  .my-color {
    color: seagreen;
  }
</style>
This tutorial won't extensively cover Svelte. For details, please refer to Svelte online documentation: https://svelte.dev/
Connecting to the dataset
Our UMAP component will apply to any dataset to visualize its instances on a 2D map. We start by specifying a dataset as the main parameter in our constructor. We then define a method update that will fetch all instances in the dataset and log them to the console. In src/components/umap/umap.component.js:
export class Umap extends Component {
  constructor(dataset) {
    super();
    this.title = 'umap [custom component 🤖]';
    this.dataset = dataset;
  }

  async update() {
    const instances = await this.dataset.items().toArray();
    console.log('instances', instances);
  }

  // ...

}
Let's add a button to our dashboard to trigger an update of our component. When implementing UMAP, this will allow us to trigger the computation of UMAP. We start by passing our trainingSet to umap. Then, we create a new button component, which triggers an update when clicked. Finally, we add the button to the dashboard.
const trainingSetUmap = umap(trainingSet);

const updateUmap = button('Update Visualization');
updateUmap.$click.subscribe(() => {
  trainingSetUmap.update();
});

// ...

dash
  .page('Data Management')
  .sidebar(input, label, featureExtractor)
  .use(trainingSetBrowser, updateUmap, trainingSetUmap);
When clicking the 'Update Visualization' button, an array containing the data of all instances should be displayed in the console.
Computing UMAP
We will use the umap-js library from the Google PAIR team. First, let's install the library:
npm install umap-js
We can then import the library and compute UMAP asynchronously, following the library's documentation. We use the fitAsync method, that takes as input a 2D data array. We can convert the instances fetched from the dataset as such an array, by concatenating all feature vectors.
import { Component } from '@marcellejs/core';
import { UMAP } from 'umap-js';
import View from './umap.view.svelte';

export class Umap extends Component {
  // ...

  async update() {
    const instances = await this.dataset.items().toArray();
    // Concatenate all instance features in a 2D array:
    const umapData = instances.reduce((data, { x }) => data.concat(x), []);
    const umap = new UMAP();
    const finalEmbedding = await umap.fitAsync(umapData, (epochNumber) => {
      console.log('Epoch', epochNumber, umap.getEmbedding());
    });
    console.log('Final embedding', finalEmbedding);
  }

  //...
}
The application should now log the UMAP fitting process in the console when clicking on the 'update visualization' button.
⚠️ Note that you will need at least 15 instances in the training set for the algorithm to work (check the console for errors)
Exposing the results as a stream
For now, the results of the UMAP computation are limited to our component. In Marcelle, we use reactive streams to expose data to the outside world. Components can expose streams that can be used by other components in a pipeline. We will create a stream called $embedding that produce events along the fitting process. Such a stream could be used by other components for further processing, but it will also help updating the visualization in the component's view in real-time.
First, we initialize the stream in the constructor, and call the component's start() method to start stream processing. Then, we will imperatively push values into the stream at each iteration of the UMAP fitting process.
import { Component, Stream } from '@marcellejs/core';
import { UMAP } from 'umap-js';
import View from './umap.view.svelte';

export class Umap extends Component {
  constructor(dataset) {
    super();
    this.title = 'umap [custom component 🤖]';
    this.dataset = dataset;
    this.$embedding = new Stream([], true);
    this.start();
  }

  async update() {
    const instances = await this.dataset.items().select(['x', 'y']).toArray();
    // Concatenate all instance features in a 2D array:
    const umapData = instances.reduce((d, { x }) => d.concat([x[0]]), []);
    const umapData = instances.reduce((data, { features }) => data.concat(features), []);
    const umap = new UMAP();
    const finalEmbedding = await umap.fitAsync(umapData, () => {
      this.$embedding.set(umap.getEmbedding());
    });
    this.$embedding.set(finalEmbedding);
  }

  // ...
}
To check if the stream works, we can monitor it in the main script src/index.js, by logging its event to the console:
trainingSetUmap.$embedding.subscribe(console.log);
Visualizing the embedding
We are now ready to visualize the resulting embedding using a scatterplot. The view will be created using Svelte, a compile-time frontend framework that plays well with reactive programming. We will use the scatter-gl library from the Google PAIR team, that provides webgl-accelerated scatterplot renderring.
Let's edit umap.view.svelte to pass our stream of embeddings to the component:
<script>
  import { ViewContainer } from '@marcellejs/design-system';

  export let title;
  export let embedding;
</script>

<ViewContainer {title}>
  <div>{$embedding}</div>
</ViewContainer>
export let embedding; defines a 'prop', that will be accessible when the component instanciation. {$embedding} means that we consider that embedding is a data stream (a 'store' in svelte's terminology), and that the DOM will be updated reactively.
Let's correct our view's instanciation in the component definition (umap.component.js), to pass our stream this.$embedding to the component's embedding prop:
export class Umap extends Component {
  // ...

  mount(target) {
    const t = target || document.querySelector(`#${this.id}`);
    if (!t) return;
    this.destroy();
    this.$$.app = new View({
      target: t,
      props: {
        title: this.title,
        embedding: this.$embedding,
      },
    });
  }
}
When trying the application again, the view should display the list of generated values reactively. Let's replace it with a scatterplot visualization.
First, we need to install the scatter-gl library:
npm install scatter-gl
We then integrate scatter-gl in the Svelte component:
<script>
  import { ScatterGL } from 'scatter-gl';
  import { onMount } from 'svelte';
  import { ViewContainer } from '@marcellejs/design-system';

  export let title;
  export let embedding;

  let scatterContainer;
  let scatterGL;
  onMount(() => {
    scatterGL = new ScatterGL(scatterContainer, {
      styles: {
        point: { scaleDefault: 1.6, scaleSelected: 2, scaleHover: 2 },
      },
    });

    embedding.subscribe((points) => {
      if (points.length > 0) {
        const dataset = new ScatterGL.Dataset(points);
        scatterGL.render(dataset);
      }
    });
  });
</script>

<ViewContainer {title}>
  <div id="scatter-container" bind:this="{scatterContainer}" />
</ViewContainer>

<style>
  #scatter-container {
    height: 400px;
  }
</style>
This code requires basic svelte knowledge. The main elements are:
We include in the view a
divto receive the scatterplot that we bind to a variablescatterContainer. This means that once the component is mounted in the DOM, thescatterContainervariable will be filled with the corresponding element.The
onMountfunction schedules a callback to run as soon as the component has been mounted to the DOM. Here, we do two things:- We initialize
ScatterGLwith ourscatterContainerelement - We subscribe to the embedding stream, in order to re-render the scatterplot at each new event.
- We initialize
We obtain the following visualization:
Further Improvements
Adding Colors
We can further improve the component, for instance by using the instances' labels to define the point colors in the scatterplot. The main steps to add this feature are:
- Create a
$labelsstream which events are an array of the labels of each instance in the training set - Pass the stream as a prop to the svelte component
- In the component's
onMountfunction, subscribe to the labels stream to define the point colors, using ScatterGL'ssetPointColorermethod.
See Solution
umap.component.js:
import { Component, Stream } from '@marcellejs/core';
import { UMAP } from 'umap-js';
import View from './umap.view.svelte';

export class Umap extends Component {
  constructor(dataset) {
    super();
    this.title = 'umap [custom module 🤖]';
    this.dataset = dataset;
    this.$embedding = new Stream([], true);
    this.$labels = new Stream([], true);
    this.start();
  }

  async update() {
    const instances = await this.dataset.items().toArray();
    // Concatenate all instance features in a 2D array:
    const umapData = instances.reduce((data, { x }) => data.concat(x), []);
    const labels = instances.map(({ y }) => y);
    this.$labels.set(labels);
    const umap = new UMAP();
    const finalEmbedding = await umap.fitAsync(umapData, (epochNumber) => {
      this.$embedding.set(umap.getEmbedding());
    });
    this.$embedding.set(finalEmbedding);
  }

  mount(target) {
    const t = target || document.querySelector(`#${this.id}`);
    if (!t) return;
    this.destroy();
    this.$$.app = new View({
      target: t,
      props: {
        title: this.title,
        embedding: this.$embedding,
        labels: this.$labels,
      },
    });
  }
}
umap.view.svelte:
<script>
  import { ScatterGL } from 'scatter-gl';
  import { onMount } from 'svelte';
  import { ViewContainer } from '@marcellejs/design-system';

  export let title;
  export let embedding;
  export let labels;

  let scatterContainer;
  let scatterGL;
  onMount(() => {
    scatterGL = new ScatterGL(scatterContainer, {
      styles: {
        point: { scaleDefault: 1.6, scaleSelected: 2, scaleHover: 2 },
      },
    });

    embedding.subscribe((points) => {
      if (points.length > 0) {
        const dataset = new ScatterGL.Dataset(points);
        scatterGL.render(dataset);
      }
    });

    labels.subscribe((labs) => {
      const uniqueLabels = Array.from(new Set(labs));
      const hues = uniqueLabels.map((_, i) => Math.floor((255 * i) / uniqueLabels.length));
      const colors = hues.map((h) => `hsla(${h}, 100%, 50%, 0.75)`);
      scatterGL.setPointColorer((i) => colors[uniqueLabels.indexOf(labs[i])]);
    });
  });

</script>

<ViewContainer {title}>
  <div id="scatter-container" bind:this={scatterContainer} />
</ViewContainer>

<style>
  #scatter-container {
    height: 400px;
  }

</style>
Option for 2D/3D visualization
We can also easily support 3D visualization, using UMAP's option nComponents.
Reacting to point selection
Finally, it is useful to visualize the images associated with each point in the visualization. We can do this by creating a stream called $selected that contains the ids of the selected instances.
Final Result
The source code for the example is available on Github, and the demo is available online.